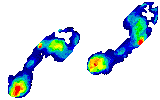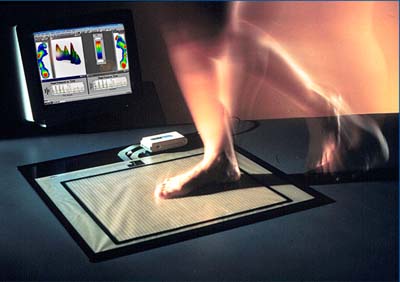
Barefoot scan. You simply walk over the mat and both pressure and timing information are stored on the computer.

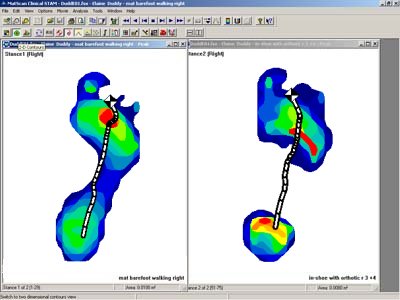
Barefoot scan: right foot. The view below shows the peak pressures during one footstep. Colours vary from blue (low pressure) through green, yellow and orange, to red (high pressure). You can see the red, high pressure area in the centre of the ball of the foot.
The line which looks like a tapeworm gives valuable timing information. When someone walks smoothly at a steady speed all the segments are the same length. A long segment shows rapid acceleration and very short segments depict slowing and stalling usually because of a locked joint which stops the ball of the foot from bending properly.

Comparisons: right foot. The first (barefoot) scan is compared with a second one, walking with orthotics. The strange red lines are simply the pressure of parts of the orthotic itself and can be ignored. It can be seen that the peak pressure has dropped to a more normal level. The segments on the timeline have opened, showing that the foot is bending better.

Analysis: bare right foot. In this example the computer takes the length of time each part of the foot is on the ground and compares it with normal times. The normal ranges (shown in white) were taken from 1000 normal scans by the Langer Corporation in America. As you can see, hardly any of the values fall within normal ranges.

Computer analysis: right foot with orthotics. As you can see, the timings in this example are much improved, now falling within normal ranges.

This subject had been considering having an operation to cure her intense foot pain. Since she has been wearing orthotics the pain has disappeared. There was no need for surgery after all.
^^Top